
Viscoelastic rubber friction is one of the fundamental phenomena governing tire-road interaction. It affects traction, braking, cornering and the ability of engineering models to reproduce how a tire behaves on a rough surface under changing velocity, temperature and deformation conditions.
Despite decades of research, rubber friction remains difficult to predict because the total friction coefficient results from mechanisms that are physically different but experimentally difficult to separate. The two principal contributions are generally identified as hysteretic friction, associated with cyclic deformation of the rubber over road asperities, and adhesive friction, generated by molecular interactions within the real contact area.
The scientific study examined here compares different theoretical formulations for estimating these contributions, with particular attention to Persson’s multiscale theory, a simplified viscoelastic formulation and the influence of empirical parameters on the resulting friction curves.
The main engineering problem is not simply obtaining a good fit with experimental data. Different combinations of roughness cutoff, surface slope, adhesive parameters, constant terms and strain-softening corrections can generate very similar friction results while assigning substantially different physical importance to adhesion and viscoelastic deformation.
This analysis connects directly with VESevo studies on tire friction and real contact-area modeling, adhesive friction and tire viscoelasticity and compound testing and viscoelastic characterization.
Friction Analysis: Adhesive and Viscoelastic Contributions
Friction Analysis of rubber sliding on a hard substrate normally starts by separating the total coefficient into two conceptual contributions: the viscoelastic component and the adhesive component.
The friction viscoelastic contribution originates from the repeated deformation of the tread when it passes over surface asperities. Because rubber is viscoelastic, part of the mechanical energy associated with these deformations is dissipated inside the material.
Adhesion instead occurs inside the real contact regions between rubber and substrate. Molecular junctions form, stretch, detach and reform as the two surfaces slide relative to one another.
The total friction coefficient can therefore be represented conceptually as the sum of viscoelastic and adhesive contributions. The difficulty lies in determining their individual magnitudes from experimental measurements.
Classic rubber-friction studies often identify two broad peaks in the friction-versus-velocity response. A higher-velocity peak is primarily associated with viscoelastic losses, while another contribution at lower velocity is generally associated with adhesion. The relative magnitude of the two, however, is not universal and depends on the rubber, substrate and operating conditions.
Why Rubber Friction Is Difficult to Decompose
Both mechanisms can generate bell-shaped responses over logarithmic sliding velocity. Consequently, an experimental friction curve does not uniquely reveal which portion originates from adhesion and which portion derives from deformation losses.
This identification problem is central to modern rubber friction analysis. A model may reproduce the total experimental curve accurately while using an incorrect physical decomposition of its individual contributions.
This issue is particularly relevant when a calibrated model is extrapolated toward different temperatures, velocities, surface textures or compounds.
Viscoelastic Friction and Persson’s Multiscale Theory
Persson’s theory provides one of the most developed formulations for calculating viscoelastic friction on rough surfaces. The theory links the surface Power Spectral Density to the complex viscoelastic modulus of the rubber and integrates the effects of roughness over multiple spatial scales.
The complete formulation accounts for the progressive change in real contact area as the surface is observed at increasing magnification. In practical partial-contact conditions, correction terms are introduced because full contact between rubber and every roughness scale is unrealistic.
Although physically sophisticated, the formulation still depends strongly on the upper roughness wavevector q1. This parameter determines the smallest roughness wavelength included in the rubber friction calculations.
The problem is that this cutoff does not have a universally accepted physical definition. Surface slope increases strongly as increasingly small roughness scales are included, meaning that the selected q1 can significantly modify the calculated friction.
The Role of Roughness Cutoff and RMS Slope
The cutoff wavevector also determines the root-mean-square slope of the rough surface. This quantity is particularly important because it influences both the viscoelastic calculation and, indirectly, the adhesive contribution through the estimated real contact area.
One reference approach selects the cutoff so that the RMS slope is approximately 1.3. The paper emphasizes, however, that this choice originates from fitting a limited set of experimental results rather than from a universally established criterion.
Simplified Viscoelastic Rubber Friction Modeling
A simpler formulation proposed by Ciavarella assumes that the finest relevant surface scale dominates the hysteretic friction calculation.
Instead of performing the complete multiscale integration, the formulation evaluates the material response at the excitation frequency generated by the selected upper cutoff wavevector.
The resulting model mainly depends on:
- surface RMS slope;
- upper roughness wavevector;
- sliding velocity;
- complex viscoelastic modulus of the rubber.
This dramatically simplifies computation and eliminates several nested integrations. For the experimental case analyzed in the paper, the simplified formulation shows broadly comparable fitting capabilities to the complete Persson approach across important portions of the available data.
The result does not imply that roughness is physically a single-scale phenomenon. It indicates that the additional numerical complexity of a full multiscale model does not necessarily provide a uniquely better friction estimation when key empirical parameters remain uncertain.
Adhesive Friction Models and Empirical Calibration
The modeling of adhesive friction is even more empirical. The adhesive contribution is commonly represented through interfacial shear stress and the ratio between real and nominal contact area.
The frictional shear stress is modeled as a Gaussian-like function of the logarithm of sliding velocity. Parameters controlling its magnitude, characteristic velocity and curve width must therefore be determined experimentally.
In practice, these parameters are frequently identified after calculating the viscoelastic component and fitting the remaining difference between predicted and measured total friction.
This introduces a fundamental dependency: uncertainty in the viscoelastic model directly affects the parameters assigned to the adhesive model. The two components cannot therefore be calibrated independently with confidence from the available friction curve alone.
For additional context on adhesive mechanisms and their relationship with material properties, see the VESevo analysis of tire adhesion and viscoelastic friction.
Nonlinear Rubber Behaviour and Friction Estimation
Another complication is the nonlinear viscoelastic response of rubber. The complex modulus depends not only on temperature and excitation frequency, but also on strain amplitude.
The reference experimental work assumes that strain in asperity contact regions may be of order one. Under this condition, strain softening can reduce the small-strain modulus by approximately one order of magnitude.
This correction strongly influences the predicted real contact area and consequently the adhesive contribution. The assumed strain level is itself connected with the selected roughness cutoff, creating another interaction between empirical choices.
Nonlinear effects therefore influence rubber-tyre friction modeling particularly strongly when adhesion and real contact area are included.
The broader influence of nonlinear material properties on tire simulation is discussed in the VESevo article on nonlinear modeling of viscoelastic materials for tire applications.
Friction Measurement: Low- and High-Velocity Experimental Data
Friction Measurement provides the reference against which the theoretical formulations are evaluated. The study uses experimental data previously obtained for a tread compound sliding against a concrete substrate.
Low-velocity measurements were obtained through an experimental configuration capable of measuring the increasing branch of the friction-versus-velocity response. Additional coefficients at sliding velocities of 0.1, 0.3, 1 and 1.8 m/s were obtained using a Linear Friction Tester.
The resulting velocity friction data provide reference points covering different portions of the sliding-speed spectrum. They are used to compare theoretical curves generated by the complete and simplified formulations.
The friction tester measurements are particularly important because the model parameters cannot be evaluated solely from theoretical considerations. Experimental data remain necessary both for validation and for calibration of empirical quantities.
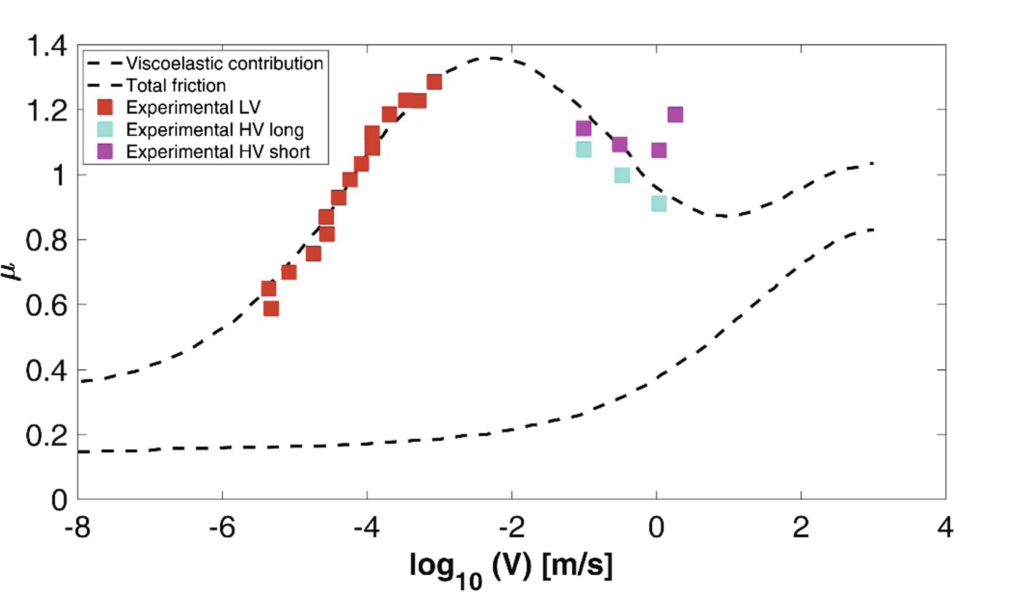
In the reference calculation, total friction is represented as the sum of adhesive and viscoelastic contributions together with an additional constant term of 0.2. This term is associated in the reference analysis with scratching of the concrete by hard filler particles in the rubber.
The paper explicitly identifies this constant as another empirical choice. Its presence illustrates why agreement with experimental data cannot automatically be interpreted as proof that every physical contribution has been identified correctly.
Friction Curves from Full and Simplified Models
When the simplified formulation is applied with the same principal parameters used by Persson’s theory, the resulting friction curves show how the adhesive, viscoelastic and total contributions evolve with sliding velocity.
At low sliding velocity, the complete and simplified approaches show relatively small differences because this region is strongly influenced by the adhesive contribution.
At higher velocity, differences between the calculated viscoelastic responses become more evident. The available high-speed measurements, however, are not reproduced perfectly by either formulation.
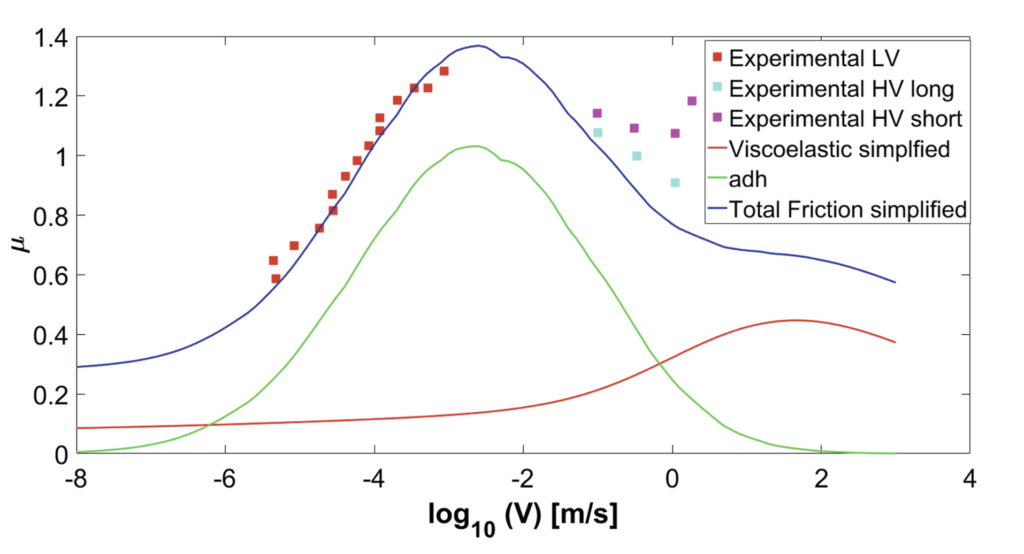
At very high sliding velocities, thermal effects may further complicate the comparison. Rapid deformation and frictional heating can modify the instantaneous viscoelastic properties of the compound and reduce the measured coefficient.
Rubber Friction Calculations and Parameter Sensitivity
The central result of the paper emerges when different combinations of empirical parameters are tested.
Five parameter sets are constructed by changing quantities including:
- upper cutoff wavevector;
- RMS slope;
- constant friction contribution;
- reference adhesive velocity;
- maximum interfacial shear stress;
- strain-softening factor.
Several of these combinations reproduce the available low-velocity measurements with similarly convincing agreement, even though the relative proportions of adhesive and viscoelastic friction are substantially different.
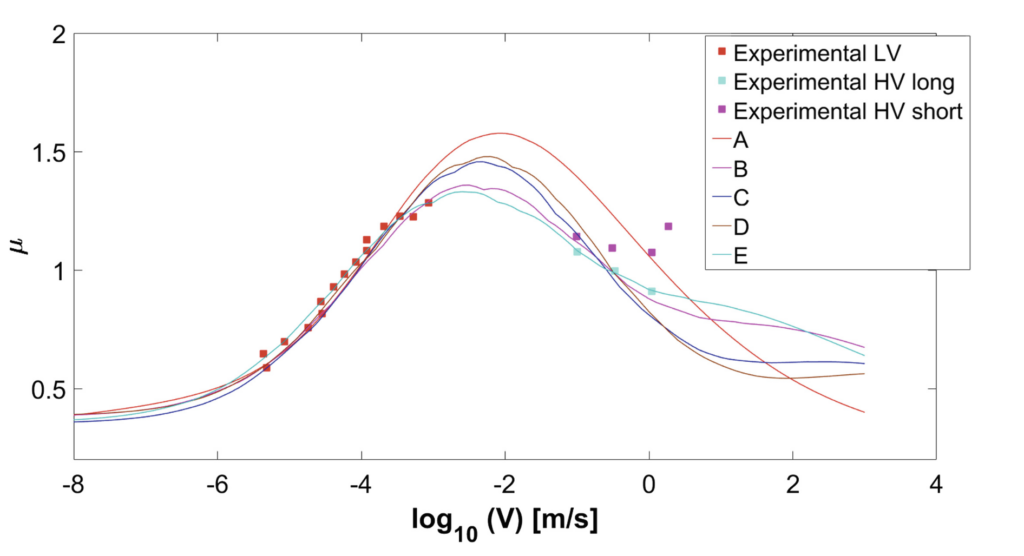
This result is critical for interpreting friction results. A visually good fit does not guarantee that the physical parameters of the model are uniquely determined.
One parameter set, for example, produces friction almost entirely through the viscoelastic component, while other sets assign a much larger role to adhesion. Several of these alternatives still reproduce much of the available experimental information.
The uncertainty becomes more evident at higher sliding velocities, where some configurations diverge substantially from the measured response.
Friction Estimation: Why Good Fitting Is Not Enough
For tire modeling, this distinction has major consequences. Friction estimation is frequently used beyond the precise conditions in which model parameters were originally calibrated.
If two parameter combinations reproduce the same measured curve but attribute friction to different mechanisms, their predictions can diverge when temperature, sliding velocity, contact pressure, strain or road roughness changes.
This means that model validation should not rely only on minimizing curve-fitting error. Independent measurements of material properties, road texture, real contact area and temperature can help reduce parameter ambiguity.
The relationship between real contact area and friction is examined in more detail in the VESevo article on tire-road contact area and friction prediction.
Multiscale and Simplified Rubber Friction Models
The paper does not argue that multiscale roughness is physically irrelevant. Real surfaces clearly contain asperities distributed over many spatial scales, and spectral characterization remains fundamental.
The key finding is instead that the increased mathematical complexity of the complete multiscale formulation does not necessarily result in a clearly superior decomposition of the measured friction response.
The simplified formulation offers immediate calculation without recursive integrations and extensive interpolation while maintaining comparable fitting capabilities for significant parts of the available dataset.
However, simplification does not remove the principal physical uncertainty. Both approaches remain highly sensitive to the roughness cutoff, while adhesive models continue to rely on empirical parameters.
Engineering Implications for Rubber Friction Models
The study has several implications for engineers working with friction and tire-road interaction.
An advanced friction model should not be judged exclusively by the closeness of its calculated curve to one experimental dataset. Model parameters should remain physically meaningful and ideally be supported by independent measurements.
Reliable viscoelastic inputs are particularly important because the complex modulus determines the deformation response used by both simplified and multiscale formulations. Non-destructive characterization can therefore contribute to more representative friction inputs when the properties of the finished tire are required.
For this reason, the topic also connects with VESevo research on non-destructive tire testing and viscoelastic characterization.
Limits of Current Rubber Friction Models
The study identifies several limitations that should remain visible when applying existing formulations.
- The upper roughness wavevector lacks a universally accepted physical selection criterion.
- Adhesive friction parameters require empirical calibration.
- An additional constant friction term may improve fitting without independent physical identification.
- Adhesive and viscoelastic curves overlap over broad velocity intervals.
- Nonlinear strain softening depends on an uncertain local strain level.
- High-velocity friction data are not always reproduced accurately.
- Temperature and friction-induced heating can modify the material response.
Current formulations should therefore be interpreted as physically informed models requiring careful calibration rather than as universally predictive descriptions of friction.
Frequently Asked Questions About Rubber Friction
What is viscoelastic rubber friction?
Viscoelastic rubber friction is the friction generated by internal energy dissipation when rough-surface asperities cyclically deform a rubber material during sliding.
What is hysteretic friction?
Hysteretic friction is the component associated with repeated deformation and relaxation of the rubber over roughness features. It is closely related to the frequency-dependent viscoelastic response of the compound.
What causes adhesive friction?
Adhesive friction arises from molecular interactions and localized junctions formed within the real contact area between rubber and substrate.
How is rubber friction measured in this study?
The experimental reference combines low-velocity measurements with friction coefficients obtained at 0.1, 0.3, 1 and 1.8 m/s using a Linear Friction Tester.
Why is the roughness cutoff important?
The upper cutoff defines the smallest surface wavelengths included in the calculation. It strongly influences RMS slope, viscoelastic friction and predicted real contact area.
Is Persson’s full theory always more accurate than the simplified model?
Not necessarily. For the experimental dataset examined in the study, the simplified formulation provides broadly comparable fitting capability over significant portions of the measured velocity range.
Can adhesive and viscoelastic friction be separated from one friction curve?
Not uniquely with the available information. Different parameter combinations can reproduce similar total friction curves while assigning very different relative contributions to adhesion and viscoelastic losses.
How does nonlinear rubber behavior affect friction modeling?
Large strains can reduce the effective viscoelastic modulus through strain softening. This changes real contact area and can strongly affect the calculated adhesive friction contribution.
Are current rubber friction models fully predictive?
They can support engineering analysis, but the paper emphasizes that empirical parameters and non-unique calibration currently limit genuinely predictive capability outside validated operating conditions.
Scientific Source
This article is based on: Genovese, A.; Carputo, F.; Ciavarella, M.; Farroni, F.; Papangelo, A.; Sakhnevych, A. Analysis of Multiscale Theories for Viscoelastic Rubber Friction. In: Carcaterra, A. et al. (eds), Lecture Notes in Mechanical Engineering, pp. 1125–1135, Springer Nature Switzerland, 2020. DOI: 10.1007/978-3-030-41057-5_91.
Editorial note: This article provides a technical interpretation of the cited scientific study. Friction models require compound-specific testing, road-surface characterization and experimental validation before being applied to tire development, safety analysis or motorsport simulation.