
Predicting tire wear in high-performance vehicles requires more than measuring the distance covered or the final reduction in tread depth. Wear develops through a combination of tire-road friction, thermal conditions, compound behavior, road roughness, vehicle dynamics and driving inputs. These factors interact continuously, making tire wear prediction a multidisciplinary engineering problem rather than a simple mileage calculation.
The scientific study discussed here presents a statistical and physically informed approach to tire wear modeling for high-performance vehicles. The research combines vehicle telemetry, track and asphalt characteristics, experimental tread wear measurements and the viscoelastic properties of different tire compounds. These data are organized into a multivariate database and used to compare three predictive strategies.
The investigated methods include a Feed-Forward Neural Network, Principal Component Analysis combined with multiple linear regression, and a multiple regression model based on preliminary physical correlations. The comparison is particularly useful because it shows that greater algorithmic complexity does not automatically produce a more reliable tire wear model.
The strongest results are obtained when statistical analysis is supported by an understanding of the underlying physical mechanisms. In particular, the study identifies meaningful relationships among friction power, tire surface temperature, road texture, contact patch area and the loss factor of the tread compound.
This article examines the study from the perspective of tire testing, tire analysis, tire measurement, tire characterization, tire behavior, tire performance and predictive wear modeling for motorsport and other high-performance applications.
The methodology connects naturally with previous technical research on tire wear modeling through viscoelasticity, road roughness and thermodynamic state, tire friction and local contact area modeling, non-destructive tire testing with VESevo, nonlinear modeling of viscoelastic materials for tire applications and tire adhesion analysis through viscoelastic characterization.
Tire Wear Prediction as a Multidisciplinary Problem
Tire wear prediction is difficult because wear is generated locally inside the contact patch. The relevant mechanisms depend on pressure, sliding velocity, temperature and friction distributions that vary across the tire-road interface and cannot normally be measured directly during real driving.
Traditional formulations often relate tread wear to the frictional power dissipated during contact. Frictional power depends on the interaction force and the local sliding velocity, but these quantities are themselves influenced by tire construction, maneuver type, road texture, inflation pressure, temperature and compound properties.
This creates an interconnected system. A change in tire temperature modifies the viscoelastic response of the compound. A different road profile alters tire excitation and local contact conditions. Vehicle forces and slip generate frictional energy, while the resulting thermal state can further change the behavior of the rubber.
For this reason, the study does not attempt to identify a single universal wear parameter. Instead, it creates a database containing indicators from three technical areas:
- road roughness indices;
- vehicle telemetry indices;
- tire viscoelastic indices.
Experimental tread wear measurements provide the target values used to train and test the predictive models. The resulting task is treated as a supervised regression problem because the objective is to estimate a continuous wear value rather than assign each tire to a discrete class.
Tire Testing: Building the Experimental Database
The quality of a tire wear model depends strongly on the quality and diversity of the experimental database. In this study, the data were acquired during racing events using a single-seater vehicle equipped with high-performance slick tires available in several tread compounds.
For every event, the available information included road roughness profiles, vehicle telemetry, tire compound properties and final wear levels for the individual tire sets. The original acquisitions were processed to produce representative Key Performance Indicators, or KPIs, for each run and wheel.
The global database was divided into two independent groups:
- 200 observations for model training and validation;
- 80 observations for independent model testing.
This distinction is essential. A model may fit its training data accurately while failing when applied to previously unseen conditions. The separate testing database therefore provides a more realistic assessment of generalization capability.
Before model development, the acquisitions were checked for outliers. Abnormal observations can result from sensor errors, incorrect classifications or data-processing problems and may strongly affect statistical estimates if they are not investigated properly.
Road Roughness Analysis for Tire Wear Modeling
Road roughness is one of the three main data families used by the model. Surface texture affects local tire-road interaction, rubber deformation, friction generation and material removal. A complete description therefore requires more than one average roughness value.
The paper distinguishes between macro-roughness and micro-roughness. Macro-roughness describes longer-wavelength irregularities, while micro-roughness concerns shorter-wavelength asperities and valleys. These scales influence the tire through different contact and excitation mechanisms.
The analyzed road indicators include:
- macro and micro wavelengths;
- macro and micro center-line average roughness;
- Hurst coefficient;
- surface peakiness;
- skewness;
- kurtosis.
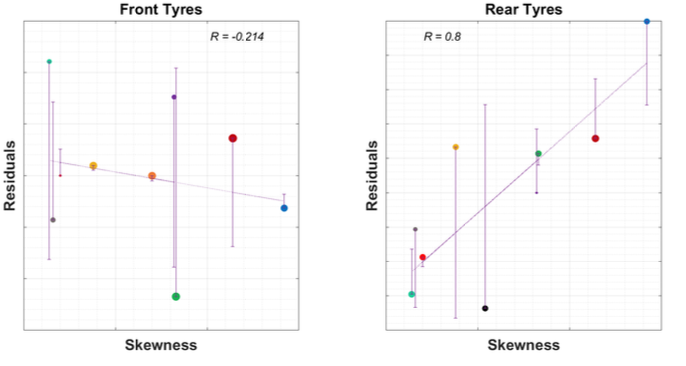
Skewness describes the symmetry of the surface-height distribution, while kurtosis provides information about its degree of peakedness. The study later identifies road skewness as a meaningful variable for explaining the residual tire wear behavior of the rear axle.
Height Difference Correlation and Power Spectral Density methods are also used to characterize the surface across different spatial scales. This produces a richer description of track texture than a single conventional roughness indicator.
Vehicle Telemetry and Friction Power for Tire Wear Modeling
Tire measurement in high-performance applications benefits from the large amount of information available through vehicle telemetry. Racing vehicles act as rolling sensor networks, continuously acquiring signals related to vehicle state, tire condition and driver inputs.
The telemetry database considered in the paper includes tire and vehicle velocities, tire surface temperature, inner-liner temperature, inflation pressure, track temperature, ambient temperature and dynamic camber. Tire interaction forces, contact patch area and slip indices are also calculated or estimated from the available signals and models.
Longitudinal and lateral sliding velocities are combined with longitudinal and lateral tire forces to calculate the corresponding friction powers. The total friction power represents the energy dissipation associated with tangential tire-road interaction over the run.
This quantity is central to the final physical-correlation approach. The study identifies an approximately linear relationship between mean tread wear and accumulated total friction power for each circuit, although the slope changes according to temperature and track characteristics.
For powers and energies, the values are accumulated over the complete run. Other telemetry quantities are represented by their average and standard deviation, allowing both the mean operating state and its variability to be retained.
Tire Characterization: Viscoelastic Properties with VESevo
Tire characterization is required because the tread compound is a viscoelastic material. Its response lies between that of an elastic solid and a viscous material, and its properties change according to excitation frequency and temperature.
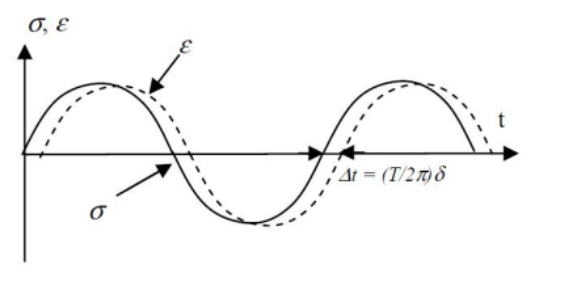
The storage modulus represents the elastic energy stored and recovered during cyclic deformation. The loss modulus describes dissipated energy, while the loss factor, tan δ, expresses the relationship between the dissipative and elastic components.
Increasing excitation frequency at a fixed temperature tends to move the compound toward a stiffer, glass-like response. Increasing temperature at a fixed frequency generally produces a softer, more rubber-like behavior. These opposite effects are represented through the Time-Temperature Superposition Principle and the Williams-Landel-Ferry relationship.
The viscoelastic properties of the compounds in the database were evaluated using the innovative VESevo non-destructive testing technology. The resulting master curves make it possible to determine storage modulus and loss factor under working conditions representative of each run.
The final viscoelastic KPIs include:
- excitation frequency;
- shifted temperature;
- storage modulus at the shifted temperature;
- loss factor at the shifted temperature.
This approach gives the statistical models access to compound information that reflects actual tire operating conditions rather than relying only on nominal material specifications. Further details are available in the article on non-destructive tire measurement and characterization.
Tire Wear Measurement and Tread-Depth Processing
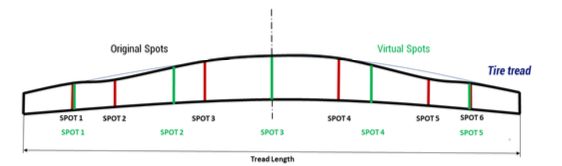
Experimental tire wear measurement was performed by reading tread-depth inspection points after each run. A professional tread-depth tool was used, and several measurements were averaged at each available spot to improve reliability.
Because the physical measurement points were not equally spaced across the tread width, the recorded values were interpolated. This produced virtual wear values for uniformly distributed tread ribs and allowed the measurements to be interpreted more consistently as material-volume loss.
The values were finally processed into a mean wear percentage relative to the original tread thickness. This quantity, identified as WearMean, became the response variable predicted by the statistical models.
The method provides a practical compromise between trackside measurement feasibility and the need for a structured target variable. However, an average wear value cannot fully represent localized irregular wear patterns such as graining or blistering, an issue that becomes particularly relevant for the front tires.
Tire Wear Modeling with a Feed-Forward Neural Network
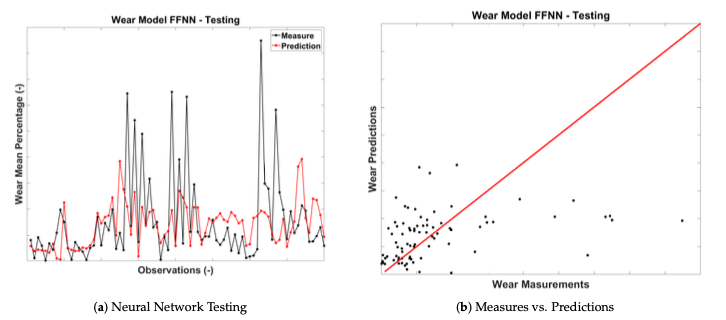
The first predictive strategy uses a Feed-Forward Neural Network. This architecture was selected because each KPI series corresponds to a different tire and wear level, with no direct temporal dependency between consecutive observations.
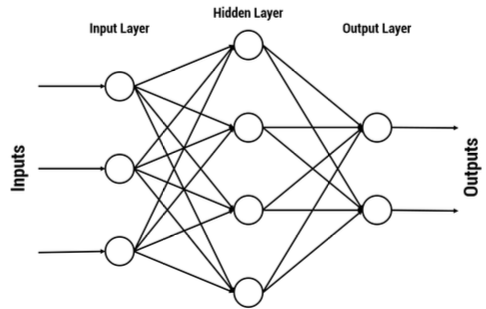
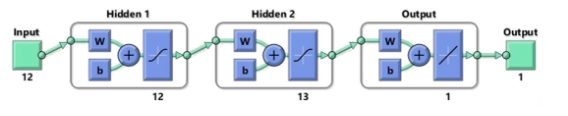
The network contains an input layer, two hidden layers and one output layer. Twelve input indicators were selected from road, telemetry and viscoelastic data, excluding strongly correlated variables and retaining KPIs with a meaningful correlation with the wear target.
The final network architecture contains 12 input neurons, two hidden layers with 12 and 13 neurons, and one output neuron. Training uses the Levenberg-Marquardt algorithm, with 80% of the larger database assigned to training and 20% to validation.
The neural network achieves reasonable results on its training data but performs poorly on the independent testing database. Its testing coefficient of determination falls to approximately 0.25, while RMSE increases substantially.
The main problem is the heterogeneous distribution of wear levels inside the training set. High-wear observations are insufficiently represented, causing inaccurate predictions and rapid overfitting. The network also provides limited direct information about which physical variables drive the output.
The result demonstrates an important engineering principle: a flexible machine-learning model cannot compensate automatically for an insufficiently large or unbalanced experimental database.
Principal Component Analysis and Tire Wear Regression
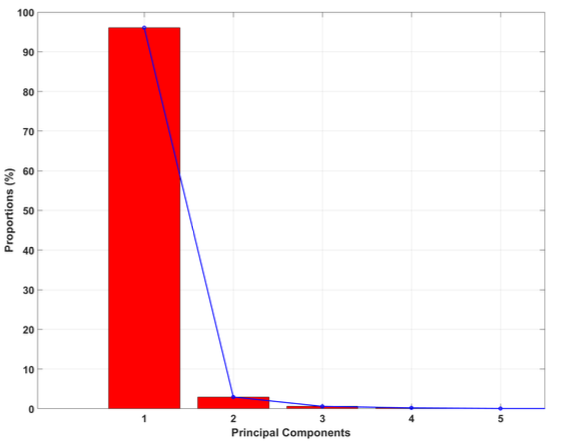
The second strategy applies Principal Component Analysis to reduce the dimensionality of the multivariate database. Seventeen mutually uncorrelated input variables are transformed into a smaller set of principal components.
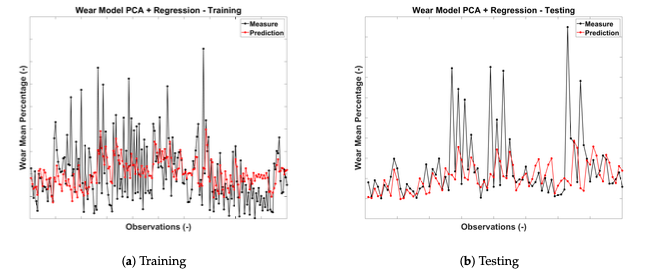
The first three principal components retain more than 99% of the variance of the initial training data. These components are then used as inputs for a multiple linear regression model.
Although the database is compressed efficiently, the resulting wear predictions are not sufficiently accurate. The model tends to estimate intermediate wear levels and underrepresents both lightly worn and heavily worn tires.
The testing coefficient of determination is approximately 0.17, and the testing RMSE is higher than that obtained with the neural network. The approach therefore preserves global data variance without necessarily preserving the relationships most relevant to tire wear.
This distinction is technically important. A variable may explain a large proportion of overall database variance without being a strong predictor of the specific engineering target.
Physical Correlations for Tire Wear Modeling
The third approach begins with an engineering analysis of the relationships among the available variables. Instead of applying a statistical model directly to the complete database, the researchers first identify functional correlations supported by tire-road physics.
Front and rear tires are analyzed separately. This decision reflects the different roles of the two axles: steering dynamics and irregular wear phenomena make front-tire behavior more difficult to describe using only global KPIs.
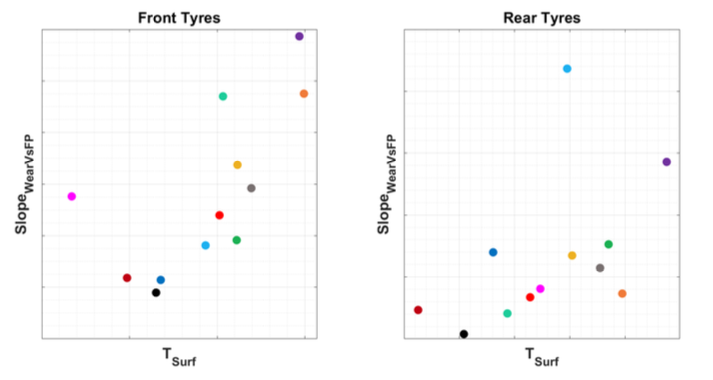
The analysis first examines the relationship between mean tire wear and accumulated total friction power for every circuit. An interpolating line is determined for each track. The slope of this relationship is then compared with tire-temperature indicators.
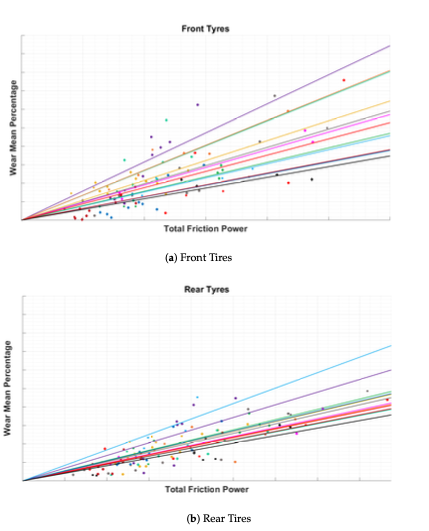
A significant relationship emerges between the wear-friction-power slope and average tire surface temperature. Residual differences are subsequently compared with road indices, revealing a useful correlation with road skewness for the rear tires.
Six physically meaningful inputs are selected for the final regression:
- road skewness;
- road kurtosis;
- average tire surface temperature;
- total friction power;
- contact patch area;
- loss factor at the shifted temperature.
This set combines all three areas of the database: road characteristics, telemetry and tire viscoelasticity. The approach therefore remains multidisciplinary while using a relatively compact and interpretable regression structure.
Tire Behavior: Why Front and Rear Wear Differ
Tire behavior differs between the front and rear axles because the two positions experience different combinations of steering, traction, braking, load transfer and slip.
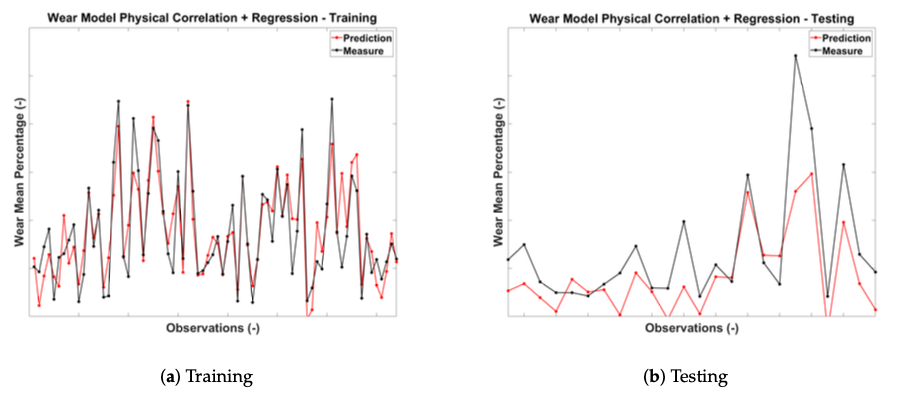
The study finds that the rear-tire wear response is more effectively represented by the selected physical KPIs. For the rear model, the physically informed regression reaches a training R² of approximately 0.81 and a testing R² of approximately 0.52, with a testing RMSE of about 7.15.
The front-tire model performs less effectively, with a testing R² of approximately 0.34. The paper attributes this limitation partly to irregular wear phenomena that are difficult to describe using the available mean-value indicators.
Graining and blistering can create localized or nonlinear degradation patterns that are not fully captured by average friction power, temperature and road indices. Steering dynamics also expose the front tires to operating conditions that differ substantially from those of the driven rear axle.
This means that a single wear model for all four tire positions may hide important physical differences. Axle-specific models can provide greater interpretability and more reliable results when the data support this separation.
Tire Wear Modeling: What the Model Comparison Shows
The comparison among the three approaches provides a practical lesson for tire performance modeling. The most sophisticated algorithm is not necessarily the most effective one.
The neural network can represent nonlinear relationships, but the available database is not sufficiently large and homogeneous to prevent overfitting. PCA reduces database complexity effectively, but its principal components are designed to preserve variance rather than maximize tire wear prediction.
The physically informed regression produces the strongest overall results because the input selection is guided by known tire-road mechanisms. Friction power represents dissipated interaction energy, surface temperature influences rubber behavior, road indices describe the interacting texture, contact patch area reflects the effective interaction region and loss factor represents compound energy dissipation.
The model remains statistically simple, but its variables have clear engineering meaning. This makes the results easier to interpret, improve and transfer to other environments than a purely black-box prediction.
For high-performance vehicle development, such a model can provide preliminary indications of expected tire wear in conditions that have not yet been explored experimentally. It can therefore support test planning, compound comparison and tire-management decisions.
Tire Wear Prediction for Motorsport Strategy
In motorsport, tire wear sensitivity affects stint length, pace consistency, setup decisions and strategy. Engineers need to estimate not only the maximum performance of a compound but also how quickly its tread condition may deteriorate under specific track and operating conditions.
The model proposed in the study can provide information about wear levels from quantities that are already familiar to race engineers: friction energy, tire temperature, contact patch conditions, track texture and compound response.
This does not make the model a replacement for track testing. Instead, it provides an additional predictive layer that can help prioritize tests and evaluate scenarios that are not fully represented in the available experimental campaigns.
The method may also contribute to tire planning and compound allocation by estimating relative wear tendencies under different tracks and operating states. Its usefulness depends, however, on maintaining the input variables within ranges supported by the training data.
The paper emphasizes the need for larger and more homogeneous databases. Extending the range of observed wear levels and introducing KPIs specifically designed for irregular wear would improve the robustness of future models.
Why Physics-Informed Statistics Outperformed the Black Box
The most relevant conclusion is not that neural networks are unsuitable for tire wear prediction. Rather, it is that their performance depends heavily on database size, balance and representativeness.
When observations are limited and high-wear conditions are underrepresented, a black-box model may learn the training database without identifying relationships that generalize reliably. A physics-informed statistical approach can be more robust because its structure is constrained by known mechanisms.
The physical-correlation method also makes model limitations easier to identify. Poorer front-axle performance points directly toward missing phenomena such as irregular wear and steering-related effects. With a less interpretable model, the reason for the prediction error would be harder to isolate.
This interpretability is valuable for tire makers, racing teams, laboratories and vehicle dynamics engineers. A model should not only produce a number; it should also help explain why the expected wear changes.
The study therefore supports a balanced approach in which statistical tools complement physical tire knowledge rather than replace it.
Frequently Asked Questions About Tire Wear Prediction
What is the main objective of this tire wear study?
The study aims to develop a practical tire wear prediction model for high-performance vehicles by combining telemetry, road roughness data, tire viscoelastic properties and statistical analysis.
Which tire wear modeling approaches were compared?
The paper compares a Feed-Forward Neural Network, Principal Component Analysis combined with multiple linear regression, and a multiple linear regression based on preliminary physical correlations.
Which approach produced the best results?
The regression model based on physical correlations produced the best overall results, especially for rear tires.
Why did the neural network perform less effectively on testing data?
The available database was relatively small and did not represent all wear levels homogeneously. These limitations contributed to overfitting and reduced the neural network’s ability to predict previously unseen conditions, especially high wear values.
Why did the PCA-based regression perform less effectively?
PCA preserved most of the overall database variance, but the resulting components did not retain enough information directly relevant to tire wear prediction.
Which variables were considered in the physics-informed regression models?
The models consider road skewness and kurtosis, average tire surface temperature, total friction power, contact patch area and loss factor at the shifted temperature. The final variable selection differs according to the axle-specific model.
How is friction power related to tire wear?
Friction power represents the rate of energy dissipation associated with tire-road interaction. The study identifies a track-dependent relationship between accumulated friction energy and mean tread wear.
Why is tire temperature important?
Tire temperature changes compound viscoelasticity and influences the relationship between dissipated friction energy and tread wear.
How does road roughness influence tire wear?
Road texture affects local tire-road contact, rubber deformation and friction generation. The study identifies surface-distribution indicators, particularly skewness, as useful wear predictors for rear tires.
How were the tire compounds characterized?
The compounds were characterized through VESevo non-destructive testing technology. The resulting viscoelastic master curves allowed storage modulus and loss factor to be determined under representative operating conditions.
Why are front and rear tires modeled separately?
Front and rear tires experience different steering, force, slip and irregular wear conditions. Separate models help account for these axle-specific differences.
Can the model predict graining or blistering?
Not directly. The available mean-value KPIs do not fully describe localized irregular wear mechanisms such as graining and blistering.
Can this model replace experimental tire testing?
No. It is a predictive support tool for test planning, scenario analysis and tire management. Its outputs still require experimental validation.
What future improvements are required?
Future work requires larger and more homogeneous databases, broader coverage of wear levels and new KPIs capable of describing irregular wear conditions.
Scientific Source
This article is based on the scientific paper: Napolitano Dell’Annunziata, G.; Adiletta, G.; Farroni, F.; Sakhnevych, A.; Timpone, F. Tire Wear Sensitivity Analysis and Modeling Based on a Statistical Multidisciplinary Approach for High-Performance Vehicles. Lubricants, 11, 269, 2023. DOI: 10.3390/lubricants11070269.
Editorial note: The information presented in this article is technical and general in nature. It does not replace customized tire engineering, track testing, laboratory validation, motorsport strategy analysis or product-specific development. Predictive tire wear models should be applied within the operating ranges supported by their experimental data and evaluated by qualified professionals.